Progress
The main mission of the center for electron
microscopy of the TASC CNR INFM laboratory within CHIRALTEM project
is to establish links between XMCD and EMCD taking the advantages
of co-existence in the same group of expertise on TEM and synchrotron
radiation based spectroscopies. So far our group designed and
realized dedicated specimens and performed the relevant XMCD and
EMCD experiments. To establish links between XMCD and EMCD it
was necessary, at this initial level of knowledge, to perform
the relevant experiments physically on the same specimens. Specimens
specially designed to this purpose have been produced at TASC
and studied by XMCD, on APE beamline at ELETTRA synchrotron in
Trieste, and by EMCD by TUW in Vienna. The scheme of preparation
of one typology of specimen is shown in figure 1:
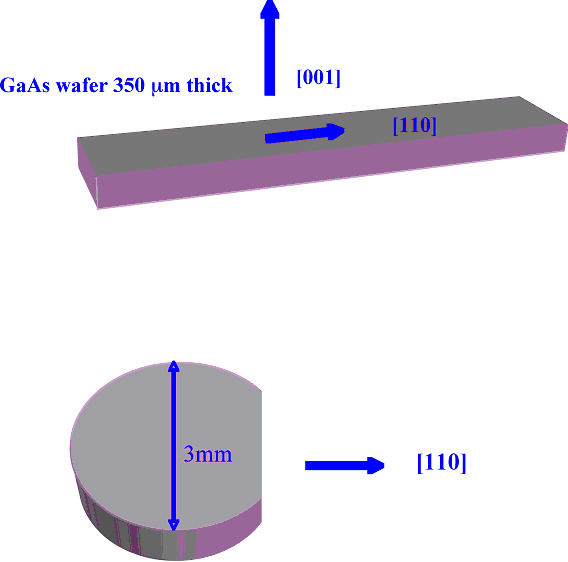
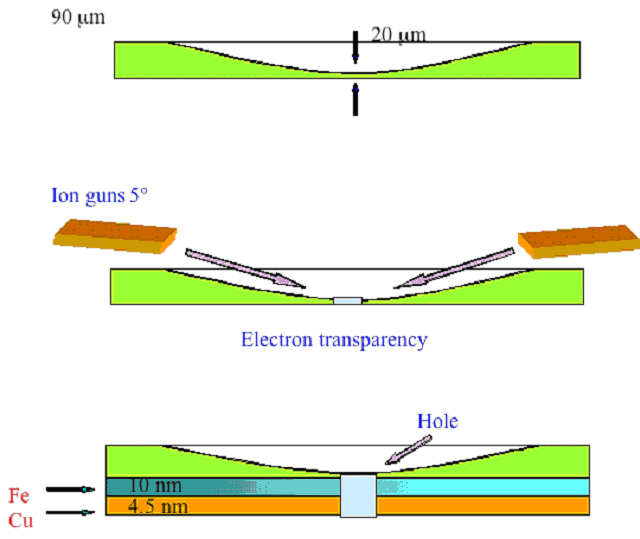
Figure 1: design and preparation of specimens
for both EMCD and XMCD experiments.
At the beginning three different specimens were
prepared. Two of them were identical and prepared starting from
a 3 mm in diameter disk cut from a [001] GaAs wafer 350 µm
thick. The disks were then marked to recognize the crystallographic
directions to study the specimen magnetisation as function of
the crystal orientation. The specimens were grinded and then ion
milled to electron transparency, so that to have a region of 90µm
thickness on the edge of the specimen (that is therefore self
supporting) and a hole in the center. The specimens were ion-milled
only on one side in order to avoid miscut angle that could influence
the epitaxial growth of the magnetic layer. To growth the magnetic
layer the specimen were transferred in ultra-high vacuum better
then 7x10-11mbar. After annealing and cleaning by ion-milling
of the GaAs surface, 10 nm of Iron have been deposited by molecular
beam epitaxy. The crystal quality of the substrate surface and
of the Fe-layer were monitored in situ by low energy electron
diffraction. The layer thickness was measured by quartz microbalance
and by Auger spectroscopy. A first capping layer of 2.5 nm of
Cu was then deposited. Measurements of transverse and longitudinal
Magneto Optic Kerr Effect showed evidence of residual in-plane
magnetisation. They also indicated that 80 Oersted are enough
to completely magnetise the sample in the in-plane hard magnetisation
direction. A secondary electrons image of the specimen was taken
at 703 eV (Fe L3-edge), then XMCD measurements were performed
by using the residual magnetisation of the sample (with the surface
tilted of 45° with respect to the incident beam, to have a
component of the magnetisation along the photon spin). The dichroic
signal was obtained by scanning in energy over the Fe L2,3 edges
and then either by flipping the circular polarisation or by rotating
the sample of 180°. The measurements have been performed on
different positions of each sample to be sure that it is magnetically
active everywhere. The result, a representative spectrum is displayed
in figure 2, showed a strong dichroic effect, with a 33% asymmetry
at the L3 edge with 50 µm of spatial resolution (but the
resolution can in principle be improved up to 200 nm).
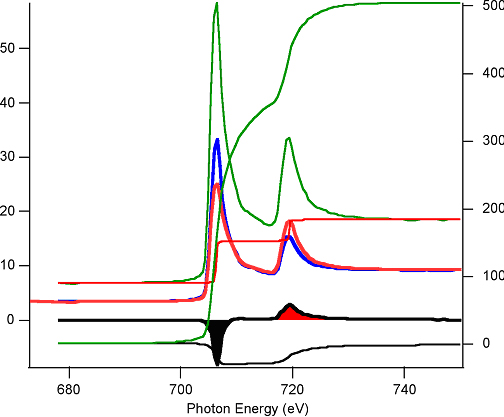
Figure 2: representative XMCD measurement.
A further capping layer of 2 nm of Cu
has been finally deposited allowing to safely remove the specimens
from the ultra-high vacuum chamber and to transfer to Vienna where
EELS spectra were taken on a FEI Tecnai F20-FEGTEM S-Twin equipped
with a Gatan Image Filter. A flat region of 100 nm radius and
uniform thickness was selected in a single grain of Fe. Chemical
microanalysis revealed negligible traces of contaminants (C, O
and Mo). The sample was immersed in the magnetic field of the
TEM objective lens pole piece, which is 1.9 Tesla and oriented
perpendicular to the surface. The magnetization of the iron film
in the TEM experiment was therefore forced to be saturated in
the out-of-plane direction by a field that is large with respect
to the in-plane coercitivity. This is crystallographically identical
to the in-plane magnetisation used in the XMCD experiment, providing
two physically equivalent conditions. The experiment shows a clear
dichroic signal, displayed in figure 3, even if the noise in the
EMCD experiment is much higher then the noise in the XMCD experiment.
|